Bioinfo BioRxiv network.
Each dot is one bioRxiv bioinformatics paper. Papers with similar abstracts sit close together
Drag to pan. Scroll or pinch to zoom. Hover a dot to see its 5 nearest papers. Click a dot to read its abstract
What
Paper network is a map of the bioinformatics preprints on bioRxiv. Each dot is one bioinformatics preprint from November 2013 onwards. The colour of a dot shows the year of the preprint, from blue for 2013 to orange for the newest year. Grey dots have no date yet
The year slider shows the map as it was at the end of each year. Press Play to see the field grow one year each second. The labels on the map name 40 topic clusters. Click a label to read a short summary of the topic and to see how many papers it got each year. This shows where the limits of knowledge moved over time
How
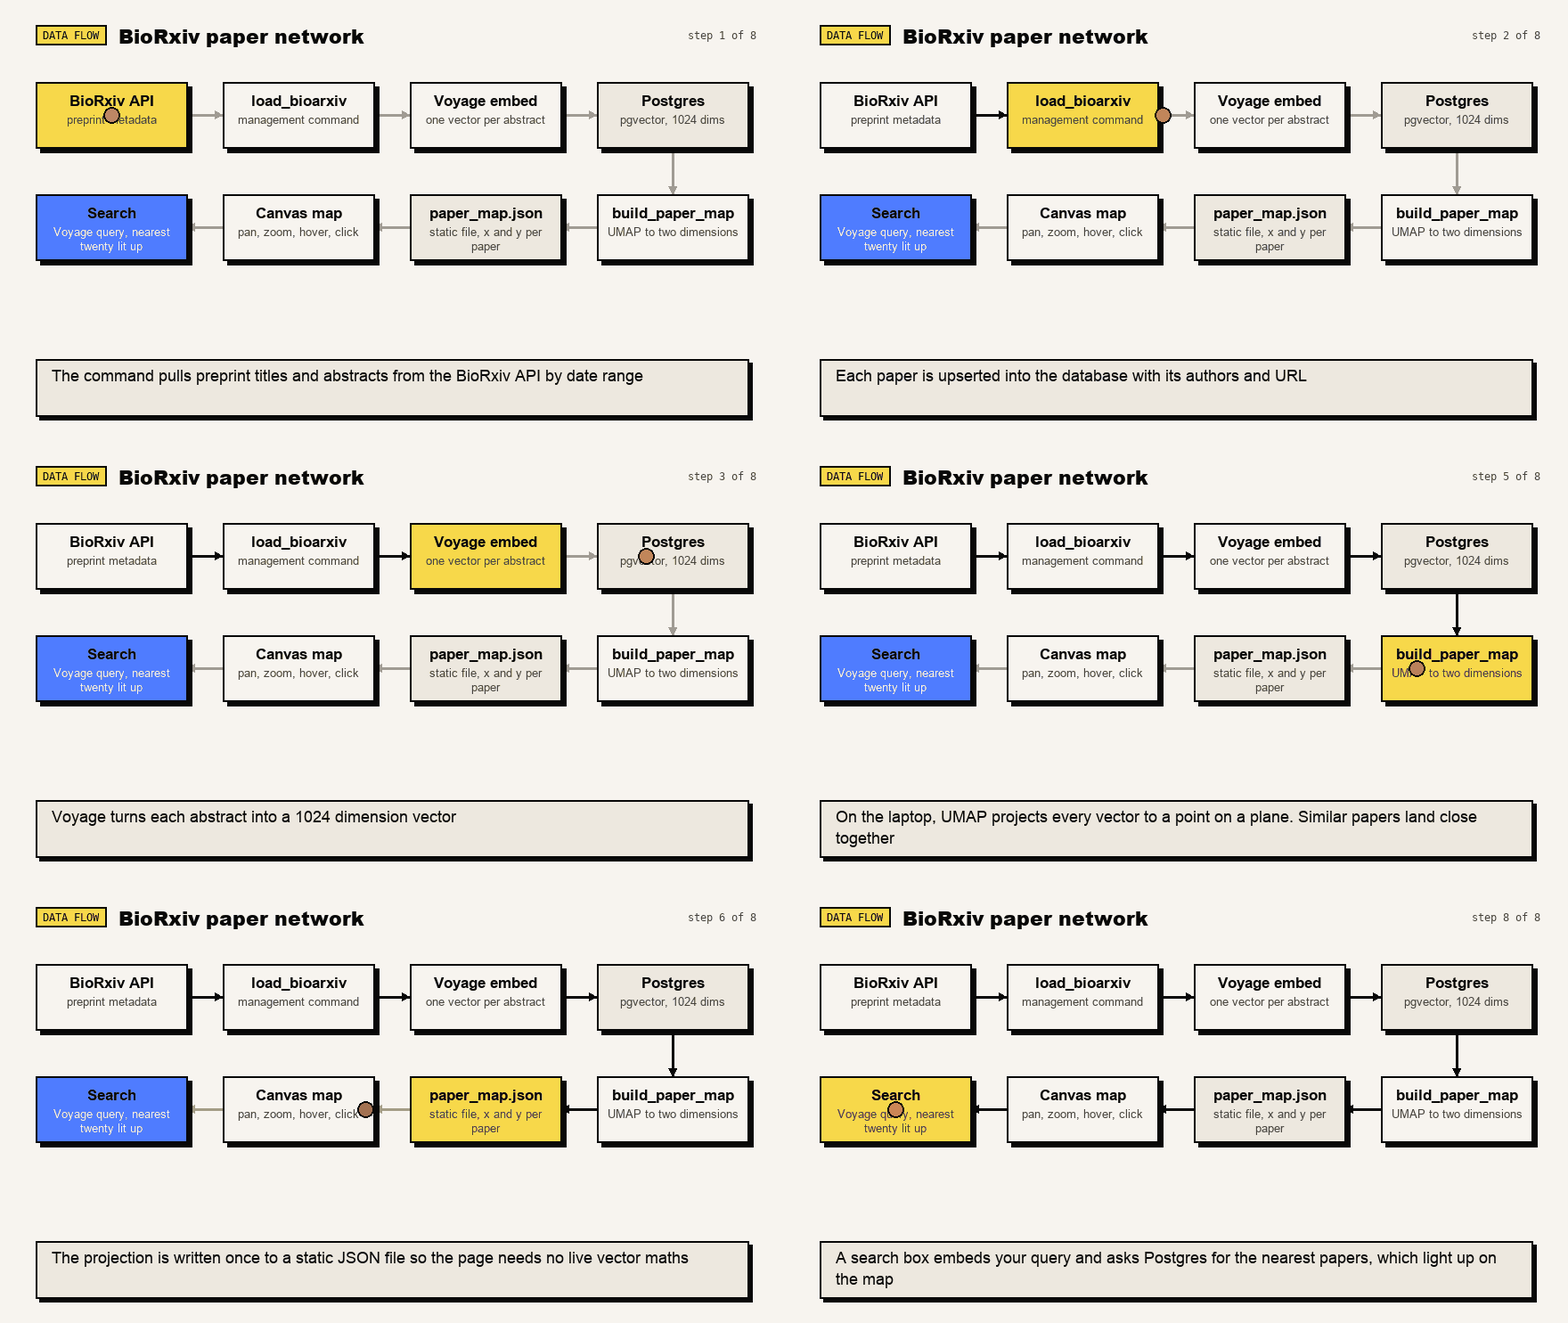
The Voyage AI voyage-4-large model embeds the abstract of each paper. That is, it turns the abstract into a numerical vector with 1024 dimensions. UMAP then puts each vector on a flat map with two dimensions. Papers with near vectors stay near on the map. The search box embeds your words with the same model and marks the 20 nearest papers in orange
KMeans then splits the flat map into 40 clusters. Claude reads the 40 titles nearest the centre of each cluster and writes a four word label and a short summary. A Cloud Run job runs on the first day of each month. It loads the bioinformatics preprints of the last 60 days, so the map grows each month
Why
Related papers cluster together, so the visualisation helps you find them. The years show which topics are new and which are old. Hover a dot to see its 5 nearest papers, or ask the Bioinfo agent about it