EVERY DAY, COUNTED.
Steps, floors, sleep, stress and resting heart rate, year by year
Daily Garmin records from Jan 2018 to Oct 2026, plus a year of Apple Watch stand data. Steps and floors show the figures. The Year On Year sparklines show only the trend. The other sleep charts show averages, and the stress plot shows one dot per day with no date. None of it is tracked by location
As of 24 Oct 2026 Fresh
Movement
Trends Over Time
Average daily steps by year, with the strongest stretches and the single biggest day, computed from Garmin's daily summaries
Average daily steps by year
* 2026 is a partial year, still in progress
Best year
2025 · 12.1k/day
Best month
Jun 2018 · 14.7k
Biggest day
34,591
Floors climbed
72k
Recent monthly average
Oct 2026 so far
8.8k
Sep 2026
11.7k
Aug 2026
11.0k
Jul 2026
9.8k
Jun 2026
9.5k
May 2026
11.7k
Updated through 24 Oct 2026
Goal Streaks
One square for each day of the last year. Green days reached the Garmin step goal. Blank days have no record. A blank day ends a streak
Step goal, day by day
NovDecJanFebMarAprMayJunJulAugSepOct
Goal reached
Goal missed
No record
25 Oct 2025 to 24 Oct 2026 · each column is one week, Monday at the top
Standing Rhythm
When the Apple Watch logged stand activity during the day. The pattern leans slightly towards the morning. The first chart is a share of the total. The grid shows mean minutes for each weekday and time of day
Stand activity by time of day
Apple Watch · Sep 2022 to Sep 2023
Stand minutes by day and time
AM
Noon
Eve
Night
Day
Mon
53364237
168
Tue
50373836
161
Wed
49434234
168
Thu
53394432
168
Fri
55393935
168
Sat
60524246
200
Sun
53453642
176
Mean minutes of stand activity on each weekday. Darker is more. The last column is the day total
The Week's Shape
Average steps and sleep for each day of the week. The weekend is yellow. Sundays average 2,100 more steps than Mondays
Average steps
Average sleep
Bars start at zero. A night counts on the day it ends, so Sat is the night from Friday into Saturday
Rest
Year On Year
Each bar is one year, scaled against the others. It shows relative shape only, with no figures attached
* the current year is still in progress, so its sample is partial
Sleep duration
'18
'19
'20
'21
'22
'23
'24
'25
'26*
easing back
REM sleep
'18
'19
'20
'21
'22
'23
'24
'25
'26*
easing back
Resting recovery
'18
'19
'20
'21
'22
'23
'24
'25
'26*
trending up
taller is calmer
Daily Load
How the days divide between calm, moderate, and high stress. Most days fall in the calm band
Stress mix
Calm · 81%
Moderate · 19%
High · 0%
Full Rest
The share of nights with seven full hours of sleep. This is the one habit that I think is worth tracking
Nights of full rest
91%
of nights
Seven hours or more, counted across the whole archive
Sleep, Split
Each bar is the average night for one year. Blue is REM sleep and the rest is all other sleep. The bar length compares the night with the longest year. The label gives the REM share
* the current year is still in progress, so its sample is partial
REM share of the average night
REM
Other sleep
Does Sleep Move Stress
Each dot is one day. It sets the sleep from the night before against the average Garmin stress score for the day. Days after longer nights tend to be calmer, with a weak link that does not show cause
Last night's sleep against today's stress
Sleep hours along the bottom, stress score from 0 to 100 up the side · Pearson r -0.23 across 2,474 days. The plot shows 2,395 of them and leaves out the outer 2% of values. The orange line is the best fit
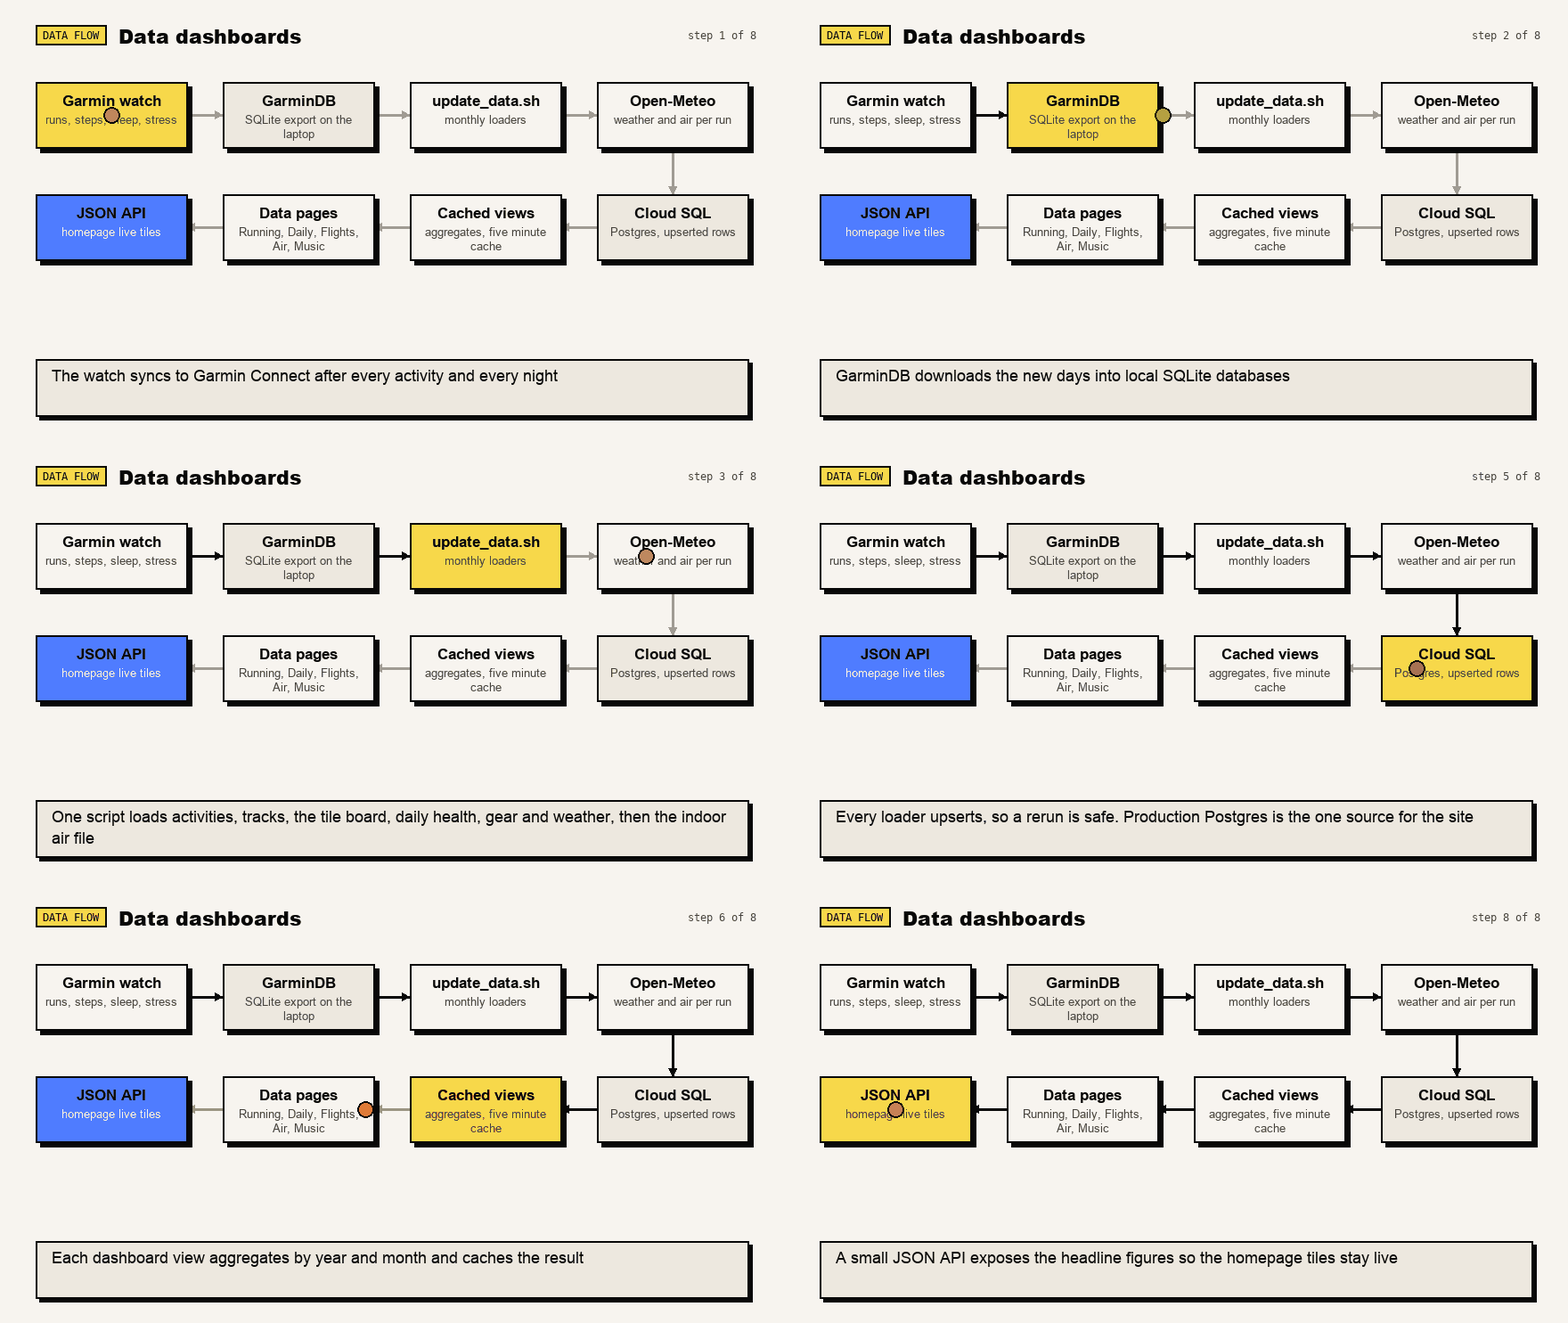
How The Data Gets Here
One monthly command pulls the exports from the watch and the apps into Postgres. The pages and the API read from there